
Vietnam Tourism Statistics 2026: 19.54 Million International Arrivals (Jan–Oct), Up 13.8%
Vietnam welcomed an estimated 19,535,396 international visitors between January and October 2026, 13.8% more than the 17,168,498 counted a year earlier. China is still the biggest source market, but most of the extra demand has come from Europe, led by Russia, and from Southeast and South Asia. South Korea, in second place, is down 6.3%. At home, domestic travelers made 133 million trips over the same ten months.
Key figures
- International arrivals, Jan–Oct 2026: 19,535,396 (+13.8% on 2025)
- October 2026: 1,854,682 (+7.0% year on year, +4.9% on September)
- Largest market: China (4,385,978, +1.4%), ahead of South Korea (3,370,543, −6.3%)
- Fastest growth among large markets: Russia (+150.0%), Philippines (+52.4%), Cambodia (+43.2%) and India (+29.5%)
- Europe: 3,221,037 visitors (+51.5%)
- Domestic tourists, Jan–Oct 2026: 133.0 million trips (+6.4% on the same period of 2025)
- Total tourism revenue, 2025: VND 1,000 trillion (+19.0% on 2024)
International arrivals by month
Each month from January to October 2026 beat the same month of 2025. January has been the busiest so far this year, with 2,453,724 visitors. March was nearly flat (+1.3%), while April, January, August and February each posted gains above 17%. The pace eased to 7.0% in October.
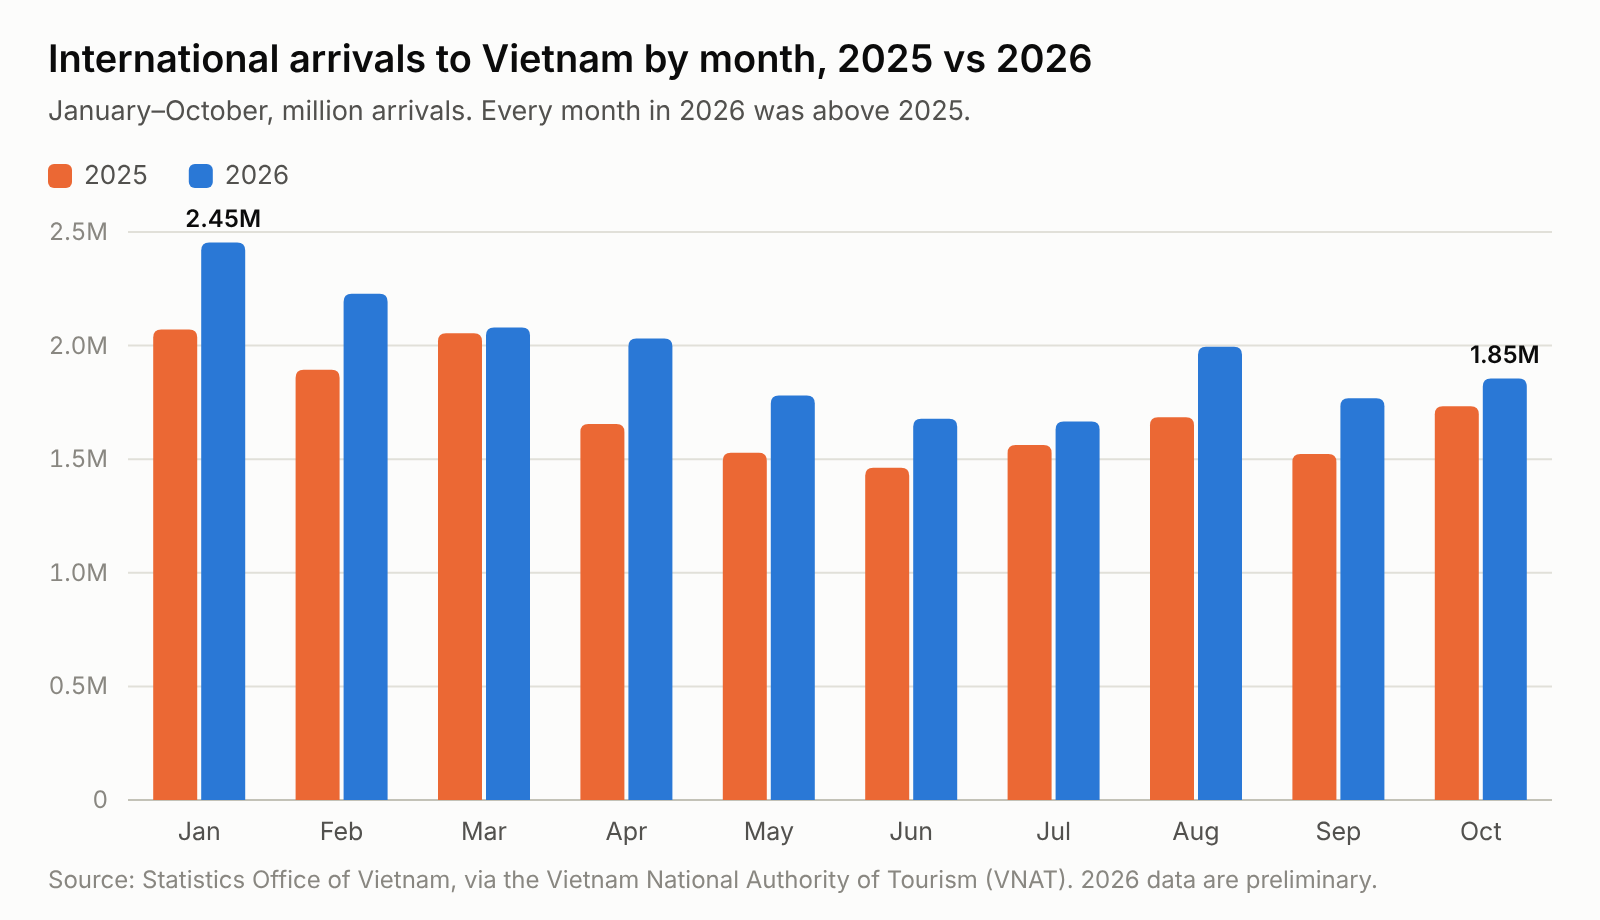
International arrivals to Vietnam by month, January–October 2025 and 2026
| Month | 2025 | 2026 | Change |
|---|---|---|---|
| January | 2,070,466 | 2,453,724 | +18.5% |
| February | 1,893,933 | 2,228,372 | +17.7% |
| March | 2,054,309 | 2,080,079 | +1.3% |
| April | 1,654,681 | 2,031,519 | +22.8% |
| May | 1,528,352 | 1,779,875 | +16.5% |
| June | 1,462,867 | 1,678,281 | +14.7% |
| July | 1,562,588 | 1,665,846 | +6.6% |
| August | 1,684,972 | 1,994,469 | +18.4% |
| September | 1,523,388 | 1,768,549 | +16.1% |
| October | 1,732,942 | 1,854,682 | +7.0% |
| Jan–Oct | 17,168,498 | 19,535,396 | +13.8% |
Source: Statistics Office of Vietnam, via the Vietnam National Authority of Tourism (VNAT). Monthly numbers are estimates; 2026 data are preliminary.
For comparison, the full-year total for 2025 was 21,168,291, a 20.4% rise on 2024.
Top source markets
China held on to first place with 22.5% of the total, although its numbers edged up just 1.4%. South Korea slipped 6.3% and is the only top-20 market in decline. Russia climbed to third after a two-and-a-half-fold jump to 1,254,174. The United States, India, the Philippines and Cambodia also posted strong gains, each above 18%.
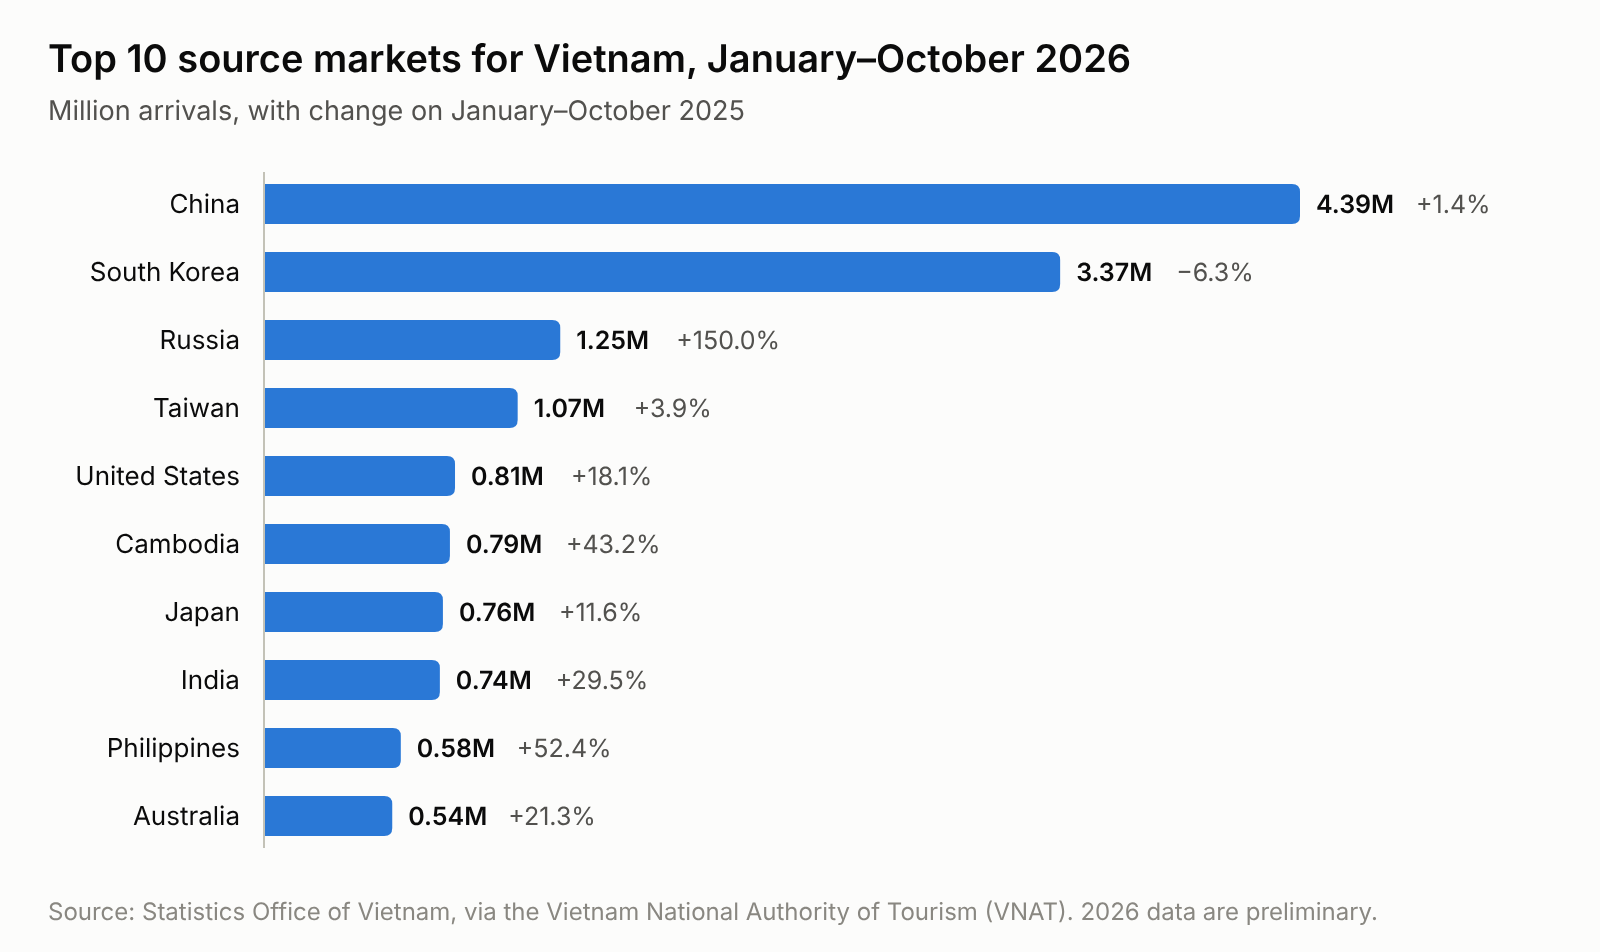
Top 20 source markets, January–October 2026
| # | Market | Jan–Oct 2026 | Share | Jan–Oct 2025 | Change |
|---|---|---|---|---|---|
| 1 | China | 4,385,978 | 22.5% | 4,327,355 | +1.4% |
| 2 | South Korea | 3,370,543 | 17.3% | 3,598,681 | −6.3% |
| 3 | Russia | 1,254,174 | 6.4% | 501,695 | +150.0% |
| 4 | Taiwan | 1,073,946 | 5.5% | 1,033,265 | +3.9% |
| 5 | United States | 808,663 | 4.1% | 684,659 | +18.1% |
| 6 | Cambodia | 787,120 | 4.0% | 549,654 | +43.2% |
| 7 | Japan | 757,468 | 3.9% | 678,633 | +11.6% |
| 8 | India | 744,567 | 3.8% | 574,968 | +29.5% |
| 9 | Philippines | 579,199 | 3.0% | 380,143 | +52.4% |
| 10 | Australia | 542,970 | 2.8% | 447,470 | +21.3% |
| 11 | Malaysia | 533,440 | 2.7% | 454,523 | +17.4% |
| 12 | Thailand | 401,451 | 2.1% | 374,211 | +7.3% |
| 13 | Singapore | 387,575 | 2.0% | 300,693 | +28.9% |
| 14 | United Kingdom | 323,675 | 1.7% | 301,002 | +7.5% |
| 15 | France | 300,135 | 1.5% | 270,199 | +11.1% |
| 16 | Germany | 261,731 | 1.3% | 229,008 | +14.3% |
| 17 | Indonesia | 216,502 | 1.1% | 170,351 | +27.1% |
| 18 | Canada | 162,860 | 0.8% | 134,898 | +20.7% |
| 19 | Laos | 162,643 | 0.8% | 158,181 | +2.8% |
| 20 | Italy | 90,210 | 0.5% | 85,259 | +5.8% |
| Other markets | 2,390,546 | 12.2% | 1,913,650 | +24.9% | |
| Total | 19,535,396 | 100.0% | 17,168,498 | +13.8% |
Source: Statistics Office of Vietnam, via VNAT (preliminary). "Other markets" covers every market not shown separately.
Beyond the top 20, smaller European markets expanded quickly too: Poland (+45.8%), Switzerland (+23.1%), Sweden (+21.4%) and Norway (+17.3%). Spain (−2.9%) was the only European market shown separately to lose ground.
Arrivals by region and mode of transport
Asia still supplies three in every four visitors, but Europe is expanding fastest, with a 51.5% increase. Air travel brings in more than four-fifths of the total, yet road crossings rose faster, by 27.1%.
| Region | Jan–Oct 2026 | Share | Jan–Oct 2025 | Change |
|---|---|---|---|---|
| Asia | 14,610,238 | 74.8% | 13,617,967 | +7.3% |
| Europe | 3,221,037 | 16.5% | 2,126,688 | +51.5% |
| Americas | 1,041,502 | 5.3% | 881,858 | +18.1% |
| Oceania | 602,734 | 3.1% | 496,178 | +21.5% |
| Africa | 59,885 | 0.3% | 45,807 | +30.7% |
| Mode of transport | Jan–Oct 2026 | Share | Jan–Oct 2025 | Change |
|---|---|---|---|---|
| Air | 16,253,092 | 83.2% | 14,581,286 | +11.5% |
| Road | 3,027,098 | 15.5% | 2,381,807 | +27.1% |
| Sea | 255,206 | 1.3% | 205,105 | +24.4% |
Source: Statistics Office of Vietnam, via VNAT (preliminary).
Domestic tourism
Domestic travelers took 133.0 million trips between January and October 2026, a 6.4% increase on the 125.0 million made in the same months of 2025. Overnight stays rose faster than same-day visits, and February was the busiest month, at 18.5 million.
Domestic tourist trips, January–October 2026 (million trips)
| Indicator | Jan–Oct 2025 | Jan–Oct 2026 | Change |
|---|---|---|---|
| Total domestic trips | 125.0 | 133.0 | +6.4% |
| Overnight visitors (stayed in tourist accommodation) | 73.5 | 80.1 | +9.0% |
| Same-day visitors | 51.5 | 52.9 | +2.7% |
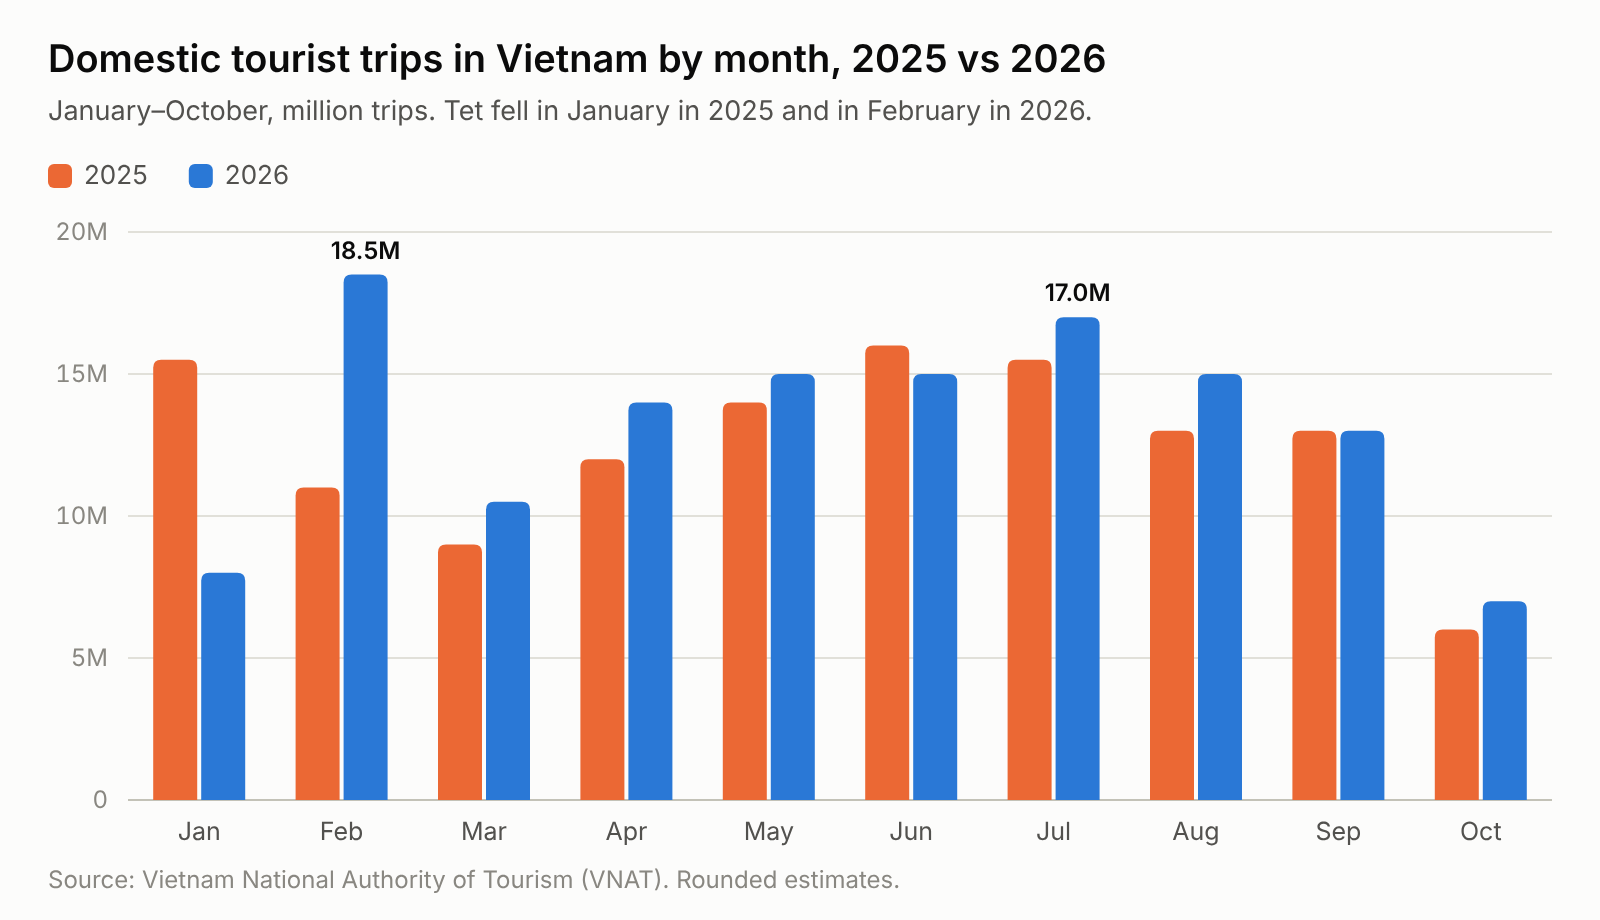
Domestic tourist trips by month, 2025 and 2026 (million trips)
| Month | 2025 | 2026 |
|---|---|---|
| January | 15.5 | 8.0 |
| February | 11.0 | 18.5 |
| March | 9.0 | 10.5 |
| April | 12.0 | 14.0 |
| May | 14.0 | 15.0 |
| June | 16.0 | 15.0 |
| July | 15.5 | 17.0 |
| August | 13.0 | 15.0 |
| September | 13.0 | 13.0 |
| October | 6.0 | 7.0 |
| November | 5.5 | – |
| December | 6.5 | – |
| Full year | 137.0 | 133.0 (Jan–Oct) |
Source: VNAT. Rounded estimates.
The January and February swing reflects the timing of Tet (Lunar New Year), which fell on 29 January in 2025 and 17 February in 2026.
Tourism revenue
Tourism revenue hit VND 1,000 trillion in 2025, 19.0% higher than in 2024 and 38% above the pre-pandemic level of 2019. No total for 2026 is available yet.
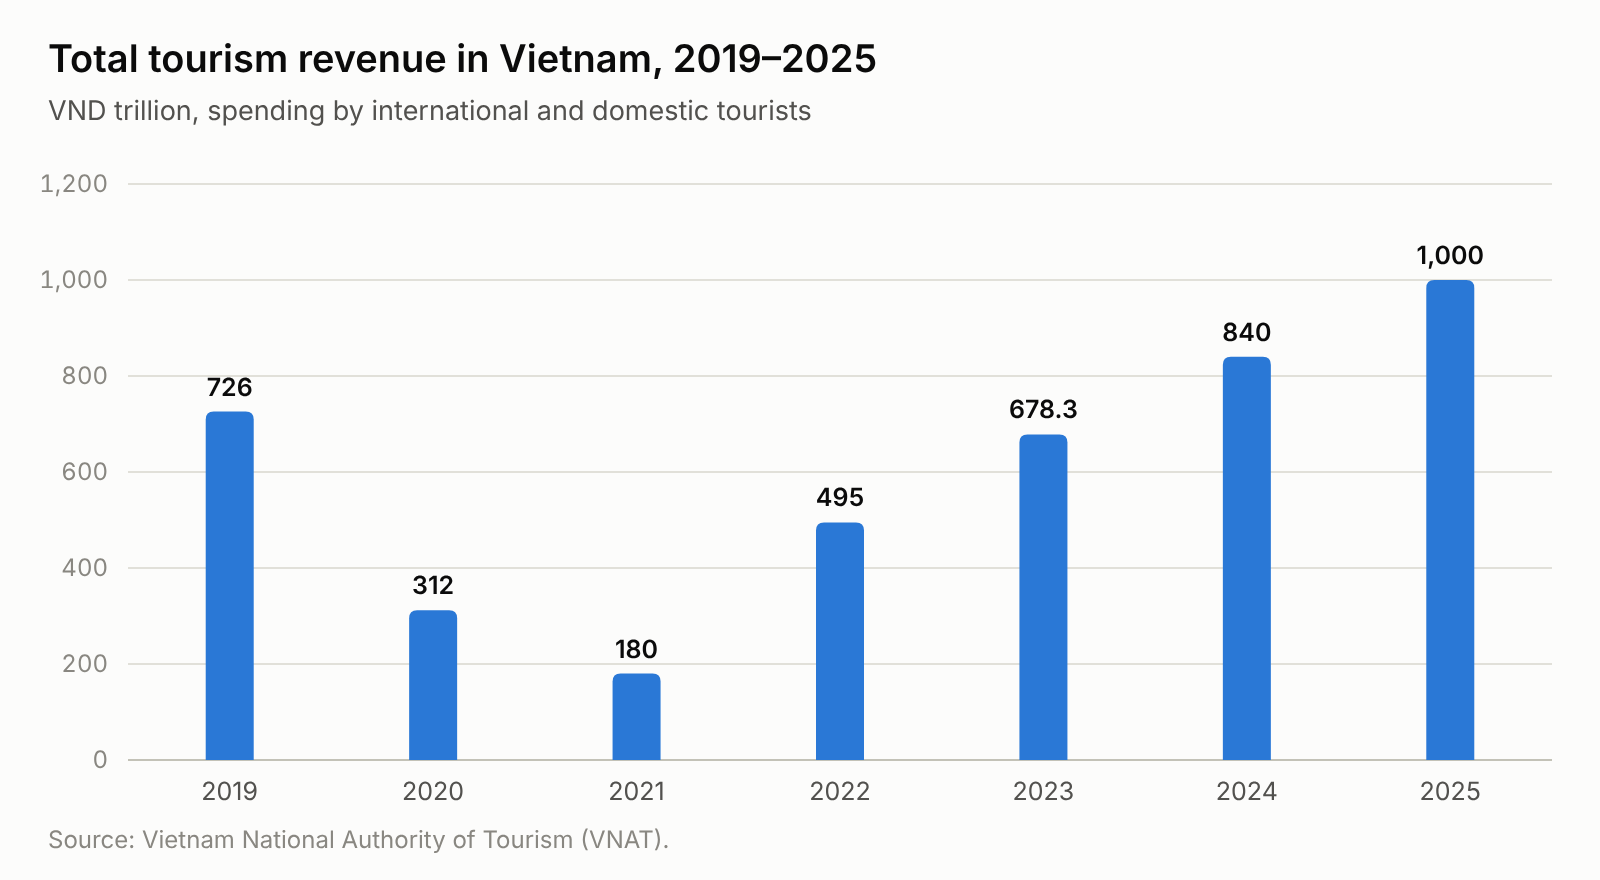
| Year | Total tourism revenue (VND trillion) | Change |
|---|---|---|
| 2025 | 1,000.0 | +19.0% |
| 2024 | 840.0 | +23.9% |
| 2023 | 678.3 | +37.0% |
| 2022 | 495.0 | +175.0% |
| 2021 | 180.0 | −42.3% |
| 2020 | 312.0 | −57.0% |
| 2019 | 726.0 | +14.0% |
Source: VNAT. Revenue covers spending by both international and domestic tourists.
Tourist accommodation
Accommodation data on VNAT's statistics page stop at 2019. That year, the country had 22,184 tourist accommodation establishments offering 499,305 rooms, with average occupancy at 52%. Of these, 930 held a 3- to 5-star rating and accounted for 138,122 rooms; 178 were five-star properties with 59,446 rooms between them.
| Year | Establishments | Rooms | Average occupancy |
|---|---|---|---|
| 2019 | 22,184 | 499,305 | 52.0% |
| 2018 | 21,611 | 401,865 | 54.0% |
| 2017 | 17,422 | 370,907 | 56.5% |
Source: VNAT.
Sources and notes
- International arrivals (monthly, markets, regions, transport): Statistics Office of Vietnam, via the Vietnam National Authority of Tourism (VNAT): international visitor statistics. October and January–October 2026 numbers are estimates released in November 2026; 2025 comparisons use the data reported for the same periods.
- Domestic tourists: VNAT domestic tourism statistics.
- Tourism revenue: VNAT tourism revenue statistics.
- Tourist accommodation: VNAT accommodation statistics (latest available year: 2019).
- Market shares are our own calculations. January–October 2025 values for markets and regions come from the October 2025 report. Percentages may not add up to 100% because of rounding.